How to analyse traffic in Google Analytics 4 (GA4)
Google Analytics 4 or GA4 is a step change in how we collect, analyse and report using Google Analytics, compared to GA3 (its predecessor) otherwise known as ‘Universal Analytics.’
One of the most obvious changes to GA4 is the change to the reporting User Interface and the loss of some reporting methods that were previously very popular with marketers.
Some of the quick and dirty methods for getting data quickly have been removed, or moved in GA4, so it’s a case of getting your head around those changes and re-orienting yourself so that you can get the data you need from GA4 with as much ease as you did in GA4.
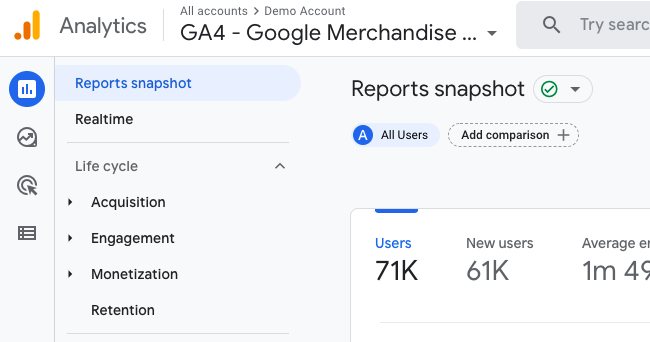
Step 1: Open up Google Analytics 4
We’re using the demo account for this, but if you have GA4 setup on your site then you should be fine to get started using your own data.
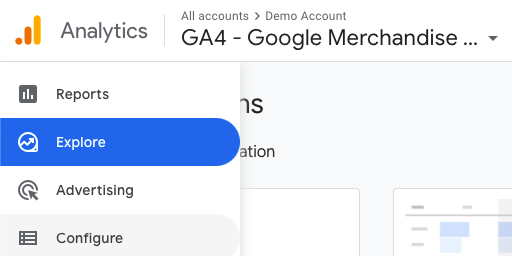
Step 2: Select ‘Explore’ from the left hand navigation
Use the left hand UI navigation to select ‘Explore’.
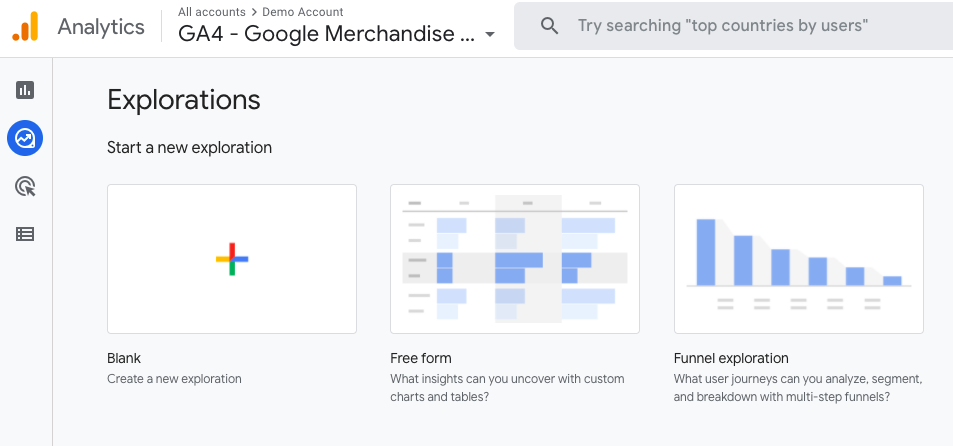
Step 3: Select ‘Blank – ‘Create a new exploration’
Once you reach the ‘Explorations’ view, you can select from either a blank exploration, or one of the pre built templates. It might be easiest to select a prebuilt template for your first time, but if you want to dive in to report building you can select ‘Blank’.
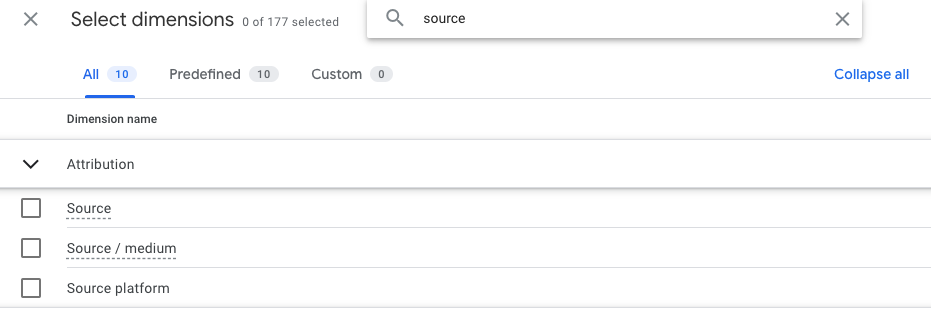
Step 4: Click the ‘+’ sign next to ‘DIMENSIONS’ to select a dimension for your report
In an exploration report, you’ll need to select dimensions to build your report. If you’re used to filtering and customising reports in Universal Analytics or the main GA4 reporting view, this is much the same.
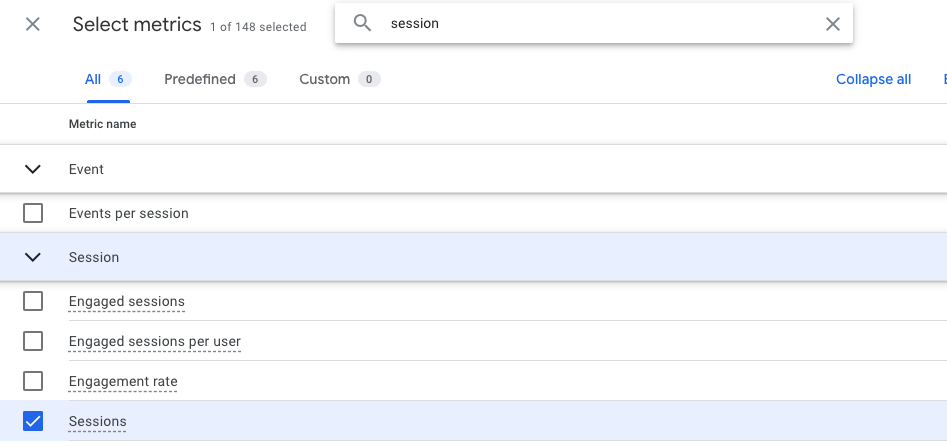
Step 5: Select a metric by clicking the ‘+’ sign next to ‘METRICS’
Select some metrics that are key to your report, but remember that not all metrics can be combined with all dimensions.
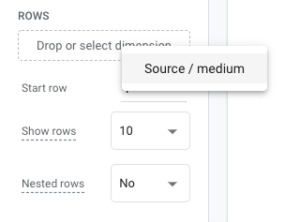
Step 6: Click ‘Drop or select dimension’ to select the a dimension that you added earlier
When assigning a dimension to ‘ROWS’ it’s important to consider the output of your report, sometimes it might be that you want a value as a ‘column’ rather than a ‘row’.
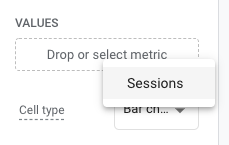
Step 7: Click ‘Drop or select values’ under the ‘VALUES’ selector
If you want to see total sessions, you’ll need to drop the ‘Sessions’ metric into the ‘VALUES’ field.
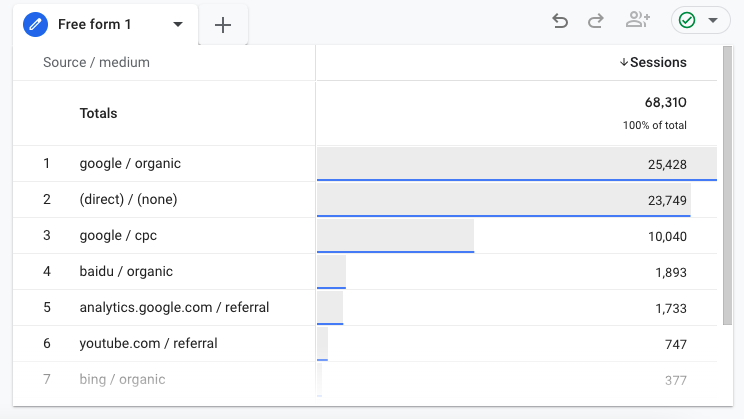
Step 8: View your basic report
Your basic traffic report is now ready, you can now start to add additional metrics, dimensions and filters to enrich the data.
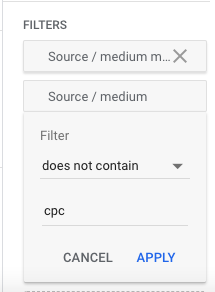
Step 9: Add a filter to exclude or include data, let’s start by excluding all ‘cpc’ traffic
Once you’ve created your report, it might be useful to filter the dataset by a dimension to see a subset of your data.
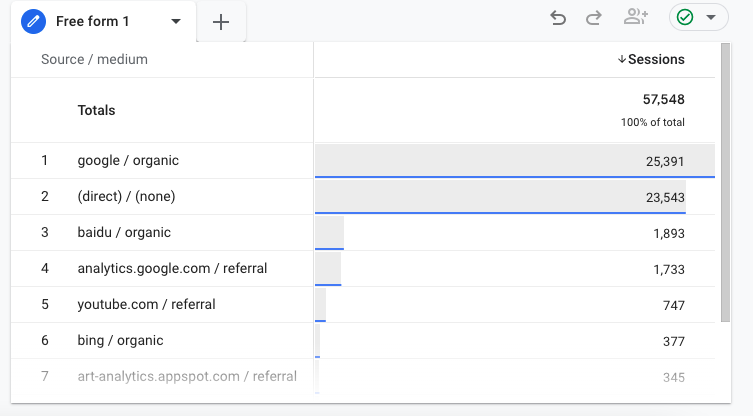
Step 10: View your non-CPC traffic data
And here you have it; you’re very first ‘free form’ exploration report.
In Summary
You can now apply those principles yourself and start to build your own exploration reports to get the data you need when you need it!
There are lots of great new reporting features via the exploration reports in GA4. It’s worth experimenting and finding some new ways of doing things that you used to do in GA3. You might even find that you start to prefer working in GA4 soon!